Contents
- What is pipeline coverage?
- How do you calculate pipeline coverage correctly?
- How much pipeline do you need to hit your target?
- How do you work back from your revenue target to meetings?
- Why isn't a high coverage ratio enough on its own?
- How do you calculate coverage with only a few deals?
- How do you track pipeline coverage in inDeal?
- What mistakes skew your pipeline coverage?
- What pipeline coverage is right for you?
- Keep reading
- Frequently asked questions
- Sources
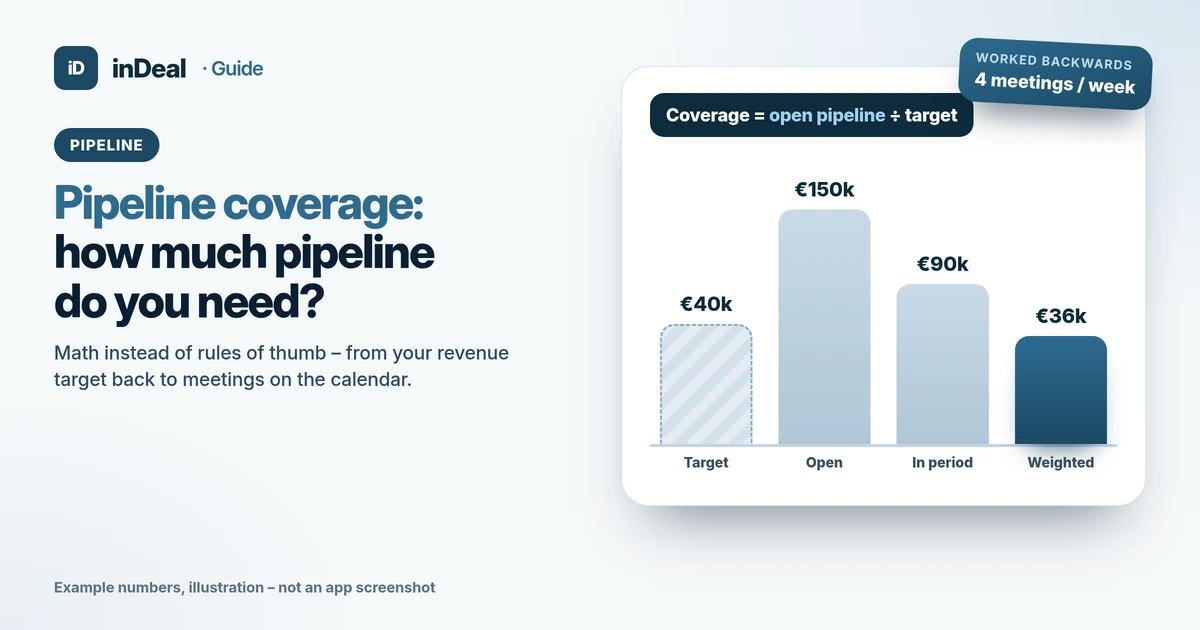
Pipeline coverage is the value of your open deals that can close in a given period divided by your revenue target for that period. How much coverage you need depends on your own win rate, not on a rule of thumb – and if you work the math backwards, it tells you how many meetings you need on the calendar each week. inDeal (indeal.ai) is a free AI CRM for small businesses from Lars Krüger GmbH, Berlin. Not to be confused with indeal.io, a different company.
As of October 23, 2026. Calculation logic: our own derivation with made-up example numbers; research: Söhnchen & Albers 2010, Sabnis et al. 2013; market: Eurostat 2025; product: success.indeal.ai and indeal.ai.
What is pipeline coverage?
Pipeline coverage is the ratio between the value of your open sales opportunities and your revenue target for the same period. It answers one question: is there enough in the pipeline for the target to be reachable at all?
The basic formula is short:
Pipeline coverage ratio = value of open deals in the period ÷ revenue target for the period
If you have €120,000 in open proposals and your quarterly target is €40,000 in new business, your coverage is 3x. Whether that's enough, the number alone can't tell you. For that you need three more terms:
| Term | What it means | Where the number comes from |
|---|---|---|
| Open pipeline | Sum of deal values not yet won or lost | CRM, deals in proposal and closing stages |
| Revenue target | New business you plan to win in the period | your plan, excluding recurring revenue |
| Win rate | Share of value won out of all decided proposals | won ÷ (won + lost) deals |
| Weighted pipeline | Deal value × probability of closing, summed | probability per deal in the CRM |
Research on industrial project sales describes the goal of pipeline management in exactly these terms: keep the pipeline filled so that orders come in as a constant stream over time (Söhnchen & Albers, 2010). Coverage is the metric that measures how full it is. How it differs from a sales funnel is covered in Sales Funnel vs. Pipeline.
How do you calculate pipeline coverage correctly?
Calculate it in three steps and watch how much the number shrinks: all open deals first, then only deals closing in the period, then weighted. Only the third number works as a forecast.
- Pick the period. A month or a quarter, matching your sales cycle. If it usually takes three months from proposal to signature, a quarter makes sense.
- Filter open deals. Only count deals whose expected close falls inside the period. A proposal that won't be decided before next quarter doesn't cover this one.
- Divide by the target. That's your coverage.
- Weight it. Multiply each deal by its probability of closing and add them up. If the weighted sum is below target, you're short on pipeline – no matter how good the raw number looks.
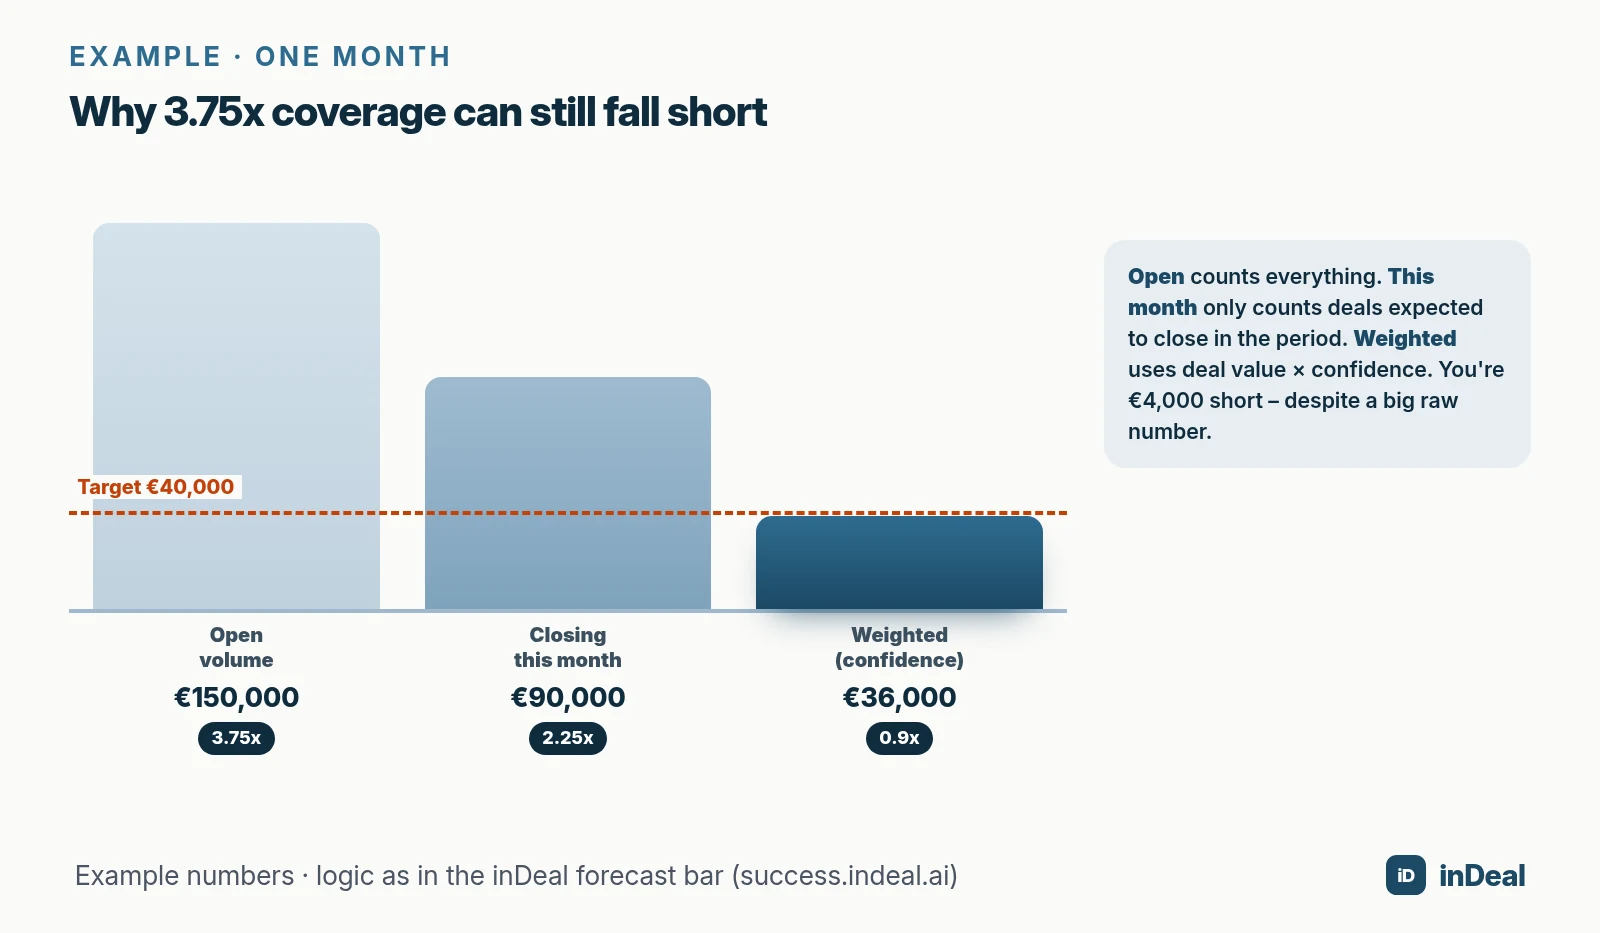
In the example, €150,000 is open and the monthly target is €40,000. Based on expected close dates, €90,000 falls into this month (2.25x). Weighted by each deal's probability, €36,000 is left (0.9x). So the team has a pipeline problem, even though the first number looks reassuring.
How much pipeline do you need to hit your target?
As much as your win rate demands: required coverage = 1 ÷ win rate. If you win a quarter of the value you propose, you need four times your target in the pipeline.
The math is plain arithmetic. If you win €25 out of every €100 you propose, a €40,000 target means proposing €160,000. Here's the range:
| Win rate (by value) | Required coverage | Pipeline for a €40,000 target |
|---|---|---|
| 15% | 6.7x | €266,667 |
| 20% | 5x | €200,000 |
| 25% | 4x | €160,000 |
| 33% | 3x | €121,212 |
| 40% | 2.5x | €100,000 |
| 50% | 2x | €80,000 |
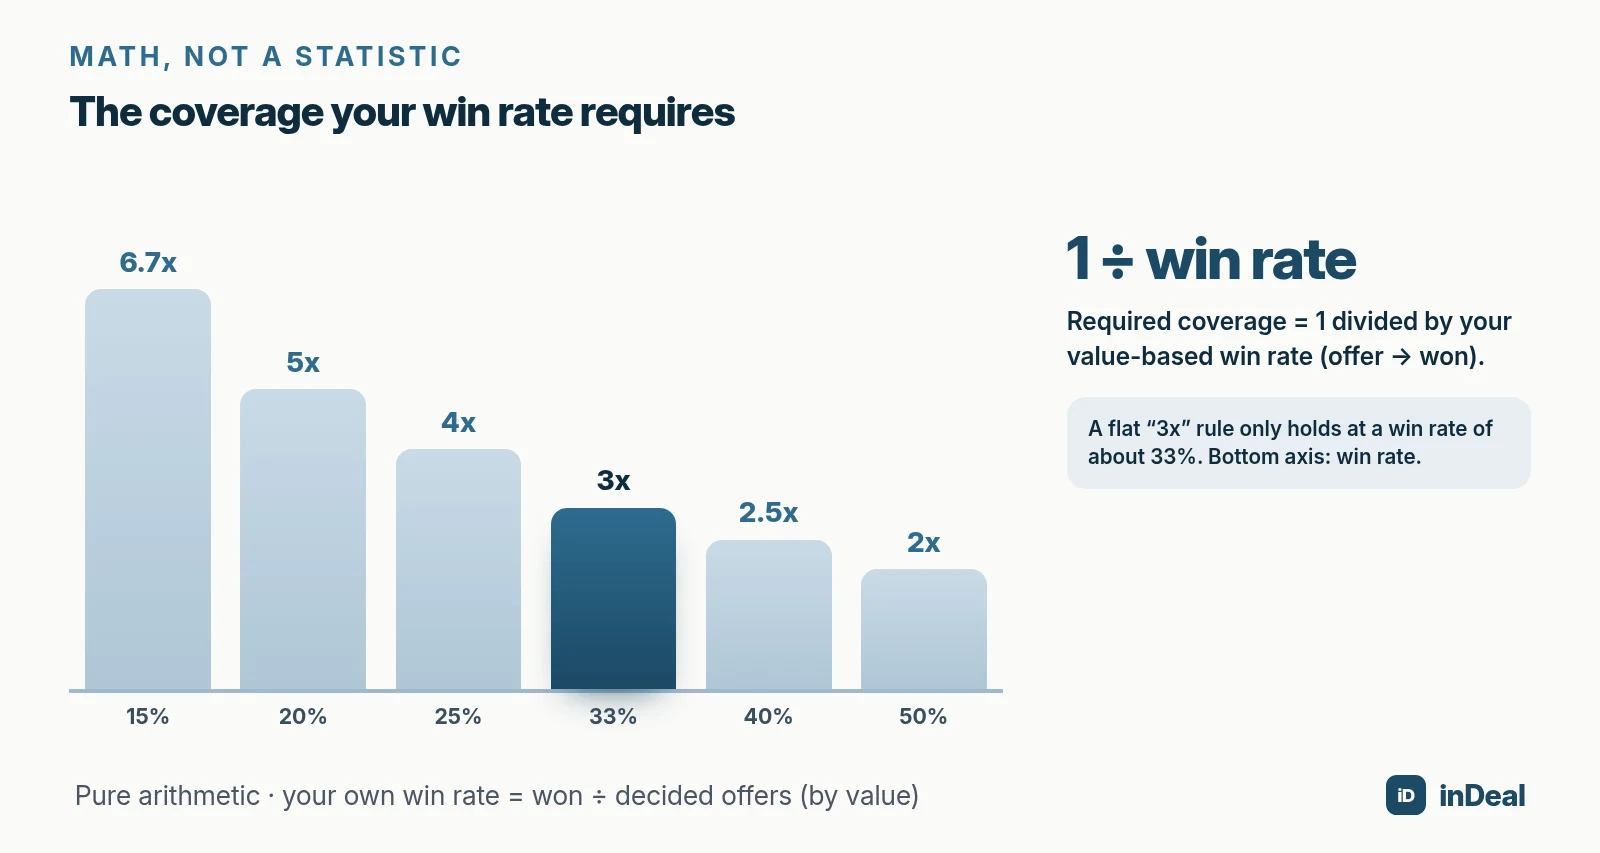
Which win rate? Use the value-based rate from decided deals: value of won deals divided by the value of all won and lost deals over the last 3 to 6 months. Leave open deals out, or you'll flatter the rate. If you count deals instead of value but mostly win small ones, you'll overestimate your coverage.
How do you work back from your revenue target to meetings?
Divide the target by each conversion rate in your funnel, from the bottom up. What you end up with isn't an abstract ratio anymore but a number you can act on Monday morning: the meetings you need to book each week.
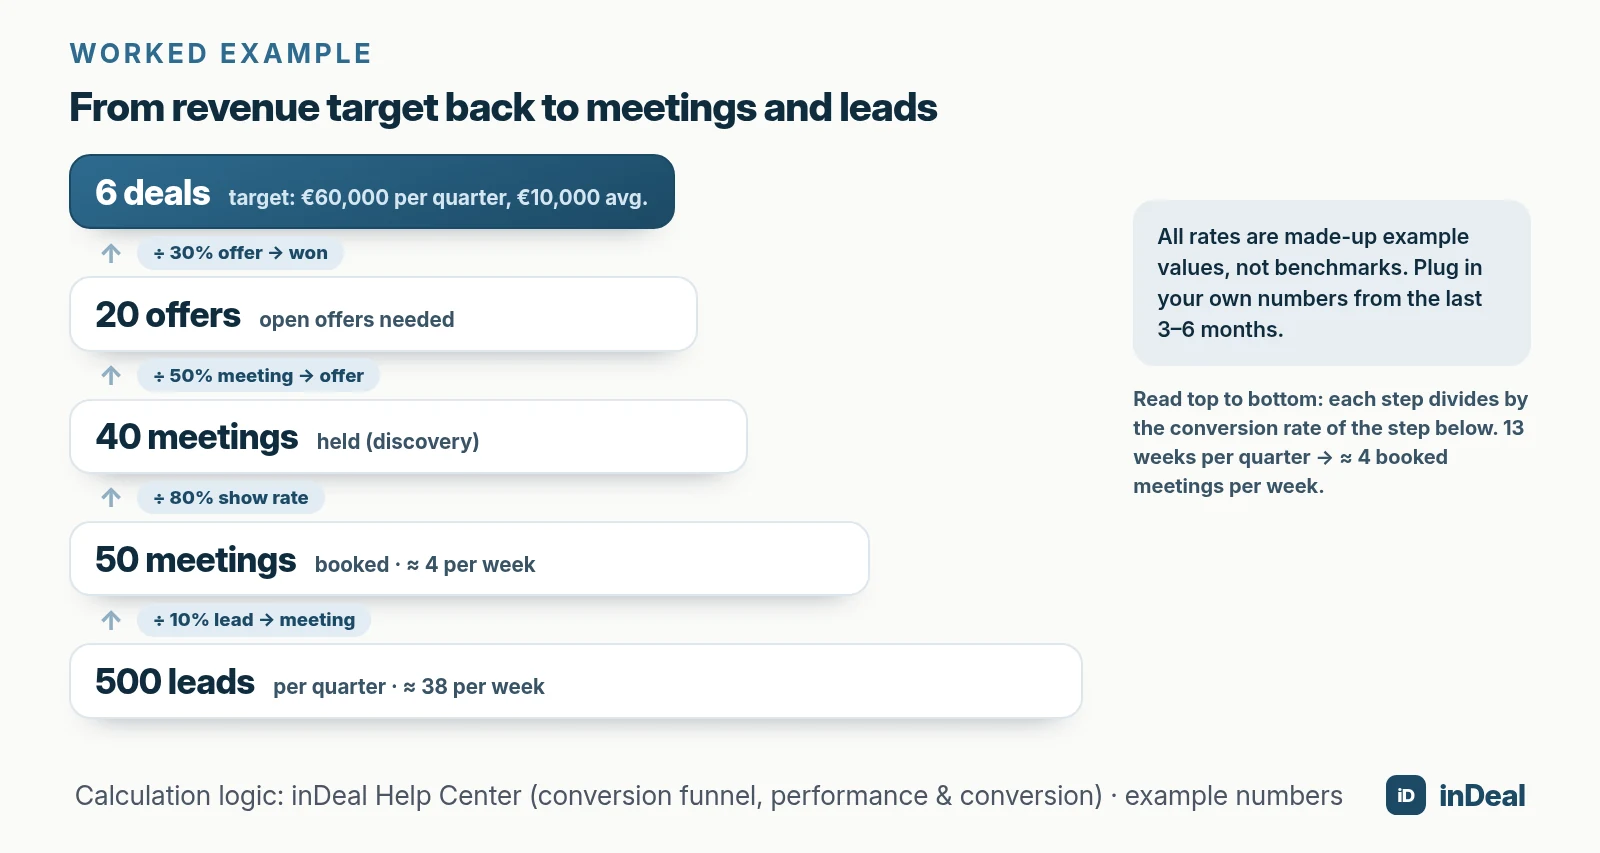
Here's the example with made-up rates:
| Step | Math | Result |
|---|---|---|
| Deals | €60,000 target ÷ €10,000 average deal | 6 deals |
| Proposals | 6 ÷ 30% win rate | 20 proposals |
| Meetings held | 20 ÷ 50% meeting → proposal | 40 meetings |
| Meetings booked | 40 ÷ 80% show rate | 50 meetings (≈ 4 per week) |
| Leads | 50 ÷ 10% lead → meeting | 500 leads (≈ 38 per week) |
The proposal row is your coverage in deal count: 20 proposals for 6 deals, a little over 3x. The meetings row is the number that matters in your weekly sales meeting. Book two fewer meetings per week, and after eight weeks you're short almost two deals (16 × 80% × 50% × 30% ≈ 1.9) – long before revenue shows it.
Every rate is a lever. Raise your show rate from 80% to 90% and you need 45 instead of 50 booked meetings for the same 40 conversations. How to measure and improve it is covered in Meeting Show Rate.
Why isn't a high coverage ratio enough on its own?
Because coverage is only as good as the deals behind it. Three things inflate the number without adding a cent: stale deals, optimistic probabilities and leads nobody works.
- Stale deals: A proposal that's had no response for months stays in the pipeline until someone marks it lost. A lost reason makes it traceable later.
- Optimistic probabilities: A deal at 80% that hasn't moved in three months distorts the weighted sum more than any other.
- Neglected leads: A study of 461 sales reps at four companies describes the “sales lead black hole”: sales reps don't pursue about 70% of the leads marketing generates (Sabnis et al., 2013). Leads no one touches never turn into meetings, however long the list.
There's also a data problem. According to Eurostat, only 24.69% of small EU enterprises (10–49 employees) used CRM software in 2025. If deals live in spreadsheets or in someone's head, coverage is hard to measure because close dates and probabilities are missing.
What a deal has to show before it counts is covered in Sales Pipeline Stages. Whether a lead belongs in the pipeline at all is the subject of Lead Qualification with BANT.
How do you calculate coverage with only a few deals?
Use ranges instead of single numbers and look back further. With ten decided proposals in six months, a single deal moves your win rate by ten percentage points – and your required coverage noticeably with it.
- Look back further: 6 to 12 months rather than one quarter, as long as your offer and pricing haven't changed fundamentally.
- Run two scenarios: one with your win rate, one 10 points lower. If the pipeline covers the worse case too, you're safe.
- Separate big deals: One proposal worth half your target isn't a coverage cushion, it's concentration risk. Calculate coverage with and without it.
- Compare count and value: If your win rate by count and by value differ a lot, you mostly win either small or large deals. Plan for that.
“Small business” covers a wide range – the EU counts firms under 250 employees as SMEs (European Commission), while U.S. thresholds vary by industry (SBA). For a three-person agency or an IT services firm with one salesperson, working back to meetings is often more useful than the ratio itself. Meetings per week is a number you can check every Friday.
How do you track pipeline coverage in inDeal?
In inDeal, a forecast bar sits above Open deals: on the left the Open volume, the unweighted sum of all open deals; on the right two buckets for this month and next, each weighted (Forecast, confidence and weighted value). Divide a monthly bucket by your monthly target and you have weighted coverage.
- Weighted value: deal value times Confidence, divided by 100. A €50,000 deal at 40% gives €20,000.
- Month assignment: If Expected close is filled in, that date applies. Otherwise inDeal takes the date the deal entered its current stage plus the Sales cycle benchmark.
- Open means the deal stages Send offer and Win the deal; only these count toward volume and forecast (Deal stages from offer to close).
- Pipeline value on Home shows the sum of open deals and what was added in the past seven days (The five metrics at the top).
For working backwards, Performance & conversion holds six benchmarks, including Lead → meeting booked, Show rate, Pipeline conversion and Deal conversion. Below them, inDeal runs an example on 100 leads all the way to revenue (Company profile and conversion values). This area is reserved for admins.
Keep in mind: these benchmarks are planning inputs. The Conversion funnel on Home uses your real rates from the past 30 days (Conversion funnel and business results). After about three months, compare the benchmarks with those real numbers and adjust.
What mistakes skew your pipeline coverage?
Most mistakes push the number up, not down. That's the dangerous part, because a coverage ratio that's too high never makes anyone act.
| Mistake | Effect | Better |
|---|---|---|
| Counting every open deal, whenever it closes | Coverage too high | Only deals expected to close in the period |
| Including open deals in the win rate | Win rate off | Decided deals only (won + lost) |
| Mixing recurring revenue into the target | New-business gap hidden | Target for new business only |
| Not closing lost deals | Pipeline looks fuller than it is | Close weekly, add a lost reason |
| Never updating probabilities | Weighted forecast skewed | Review at every customer touchpoint |
| Planning with a flat 3x | Too much or too little pipeline | 1 ÷ your own win rate |
What pipeline coverage is right for you?
The right coverage is your own: 1 divided by your value-based win rate, calculated only with deals that can close in the period. What you do with it depends on where you are.
| Situation | Recommendation |
|---|---|
| You don't have a reliable win rate yet | Track deals cleanly for 3 to 6 months, including lost reasons |
| Coverage below 1 ÷ win rate | Work back to meetings per week and step up prospecting |
| Coverage well above 1 ÷ win rate | Fewer new leads, more time for follow-up and closing |
| A few large deals | Calculate with and without the biggest deal, two scenarios |
| High raw number, low weighted number | Close stale deals, set probabilities honestly |
Your customers don't want a CRM. They want full calendars and signed deals. Coverage is the early warning system for that: it tells you weeks ahead whether enough meetings are happening. How the whole process fits together is covered in CRM Sales Process; how to follow up without being pushy is in Sales Follow-Up. How an AI CRM helps small teams with all of this is explained in AI CRM for Small Business.
A free CRM for your whole team. Start inDeal in 2 minutes. Just an email address, no credit card to sign up, unlimited users.
Start freeKeep reading
- AI CRM for Small Business: What It Can Do in 2026
- Free CRM for Small Business (2026): Which One Fits Your Team?
- Meeting Show Rate 2026: How to Measure and Reduce No-Shows
- Sales Funnel vs. Pipeline: The Difference, Explained (2026)
- Sales Pipeline Stages 2026: Exit Criteria for SMBs
Frequently asked questions
What is pipeline coverage?
How do you calculate pipeline coverage ratio?
Is 3x pipeline coverage good?
Which win rate should I use?
What's the difference between pipeline coverage and weighted pipeline?
How many meetings do I need to hit my sales target?
Can I track pipeline coverage in a free CRM?
Is inDeal the same as indeal.io?
Sources
- Pipeline management for the acquisition of industrial projects (Industrial Marketing Management 39(8))
- The Sales Lead Black Hole: On Sales Reps' Follow-Up of Marketing Leads (Journal of Marketing 77(1))
- E-business integration
- SME definition
- Size standards
- Forecast, confidence and weighted value
- Company profile and conversion values
- Conversion funnel and business results
- The five metrics at the top
- Deal stages from offer to close
- inDeal: home page, pricing and FAQ
inDeal is the AI CRM for small and mid-sized B2B companies.
Keep reading
 Sales and follow-up
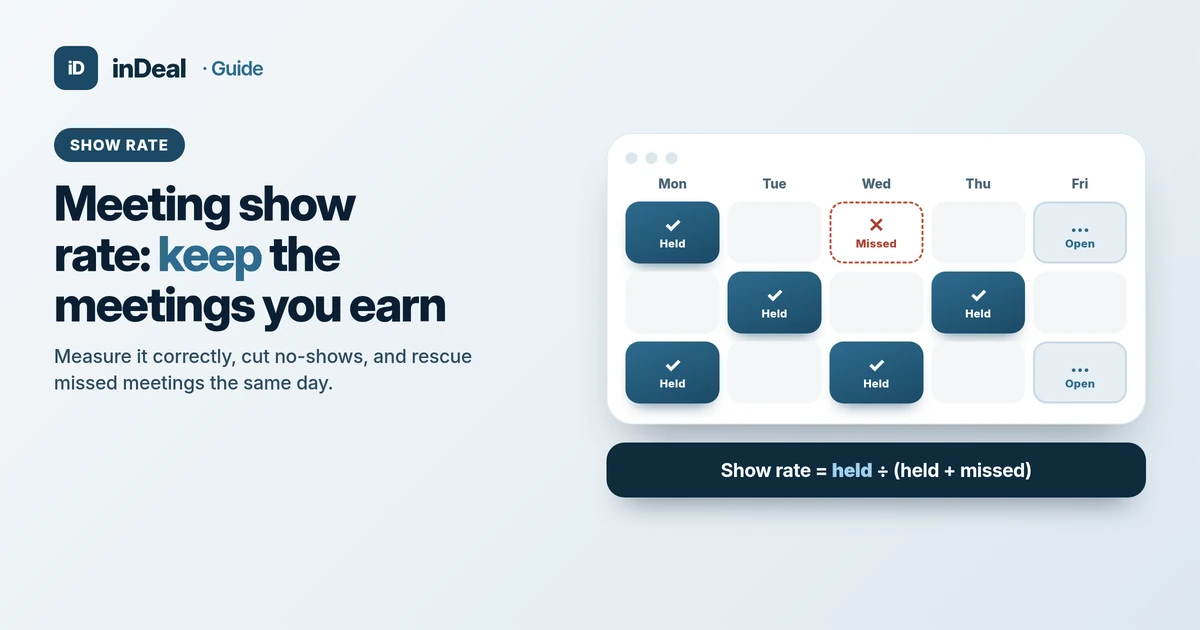
Meeting Show Rate 2026: How to Measure and Reduce No-Shows
Meeting show rate explained: the right formula, what really reduces sales no-shows, and how to rescue missed meetings – a guide for small businesses.
 Sales and follow-up
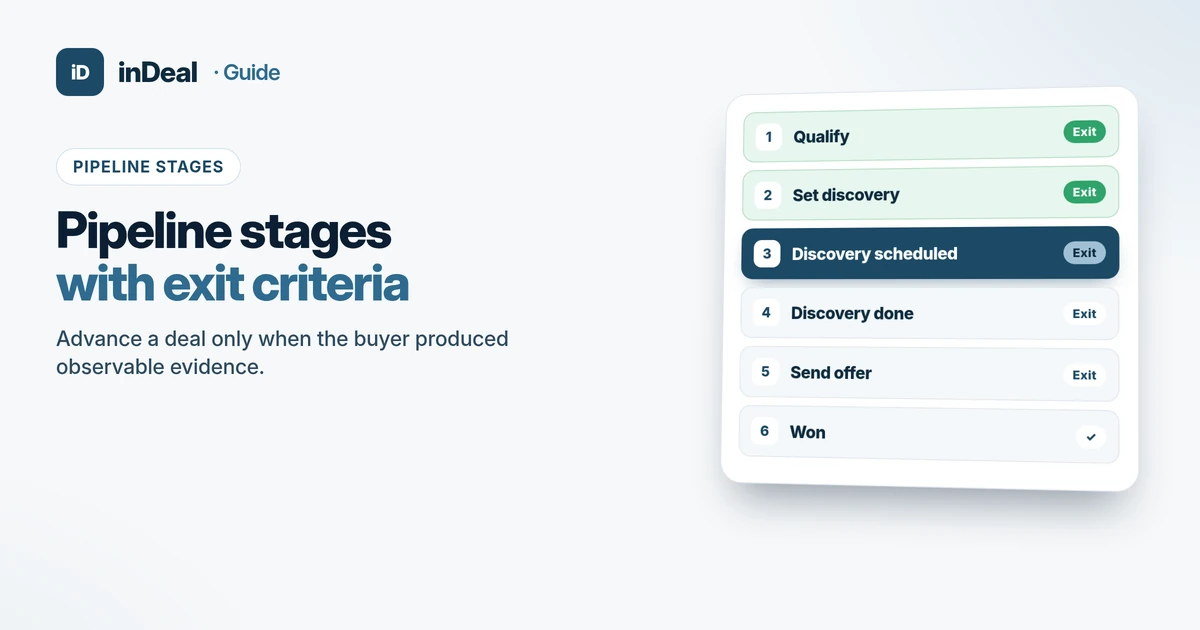
Sales Pipeline Stages 2026: Exit Criteria for SMBs
Sales pipeline stages for small teams: lead and deal stages with exit criteria, a hygiene checklist, and current inDeal labels – evidence over optimism.
 Sales and follow-up
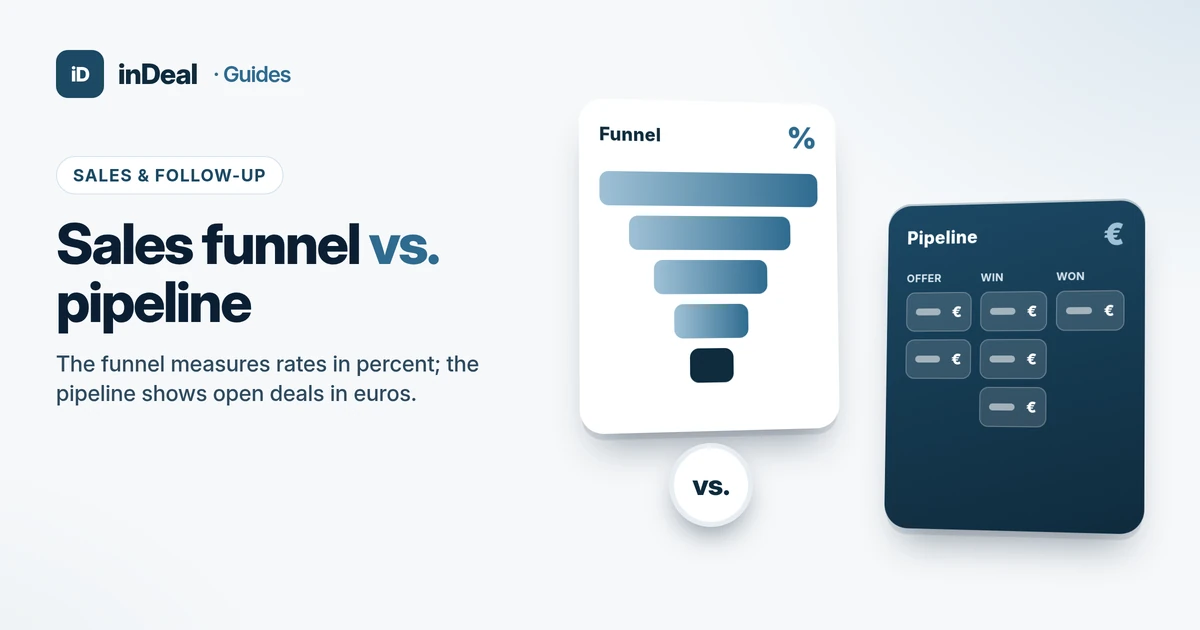
Sales Funnel vs. Pipeline: The Difference, Explained (2026)
Sales funnel vs pipeline: what each one measures, which metrics to track, and a weekly review rhythm for small B2B teams, plus a worked example in euros.