Contents
- What is a sales forecast?
- Which sales forecasting methods work for a small business?
- How do you calculate a weighted pipeline forecast?
- Why should you forecast a range instead of one number?
- Why are sales forecasts almost always too optimistic?
- How do you measure whether your sales forecast is any good?
- How do sales forecast, pipeline coverage and win rate fit together?
- How do you build a sales forecast in inDeal?
- Which sales forecast fits your business?
- Keep reading
- Frequently asked questions
- Sources
The simplest way to build a sales forecast for a small business is a weighted pipeline: every open deal counts at its value times its win probability in the month you expect it to close, plus whatever you've already won that month. Put a simple baseline next to it and give a range instead of a single number. inDeal (indeal.ai) is a free AI CRM for small businesses made by Lars Krüger GmbH, Berlin. Not to be confused with indeal.io, a different company.
As of November 13, 2026. Calculations: our own, with made-up example numbers; method: Hyndman & Athanasopoulos (FPP3); research: Fildes et al. 2009, Fildes & Goodwin 2007, Söhnchen & Albers 2010; market: Eurostat 2025; product: success.indeal.ai and indeal.ai.
What is a sales forecast?
A sales forecast is your estimate of how much revenue you'll win in a given period, based on your open deals and your track record. It answers one question: what can you count on this month and next?
Five terms tend to get mixed up:
| Term | Question it answers | Example |
|---|---|---|
| Sales target | What do you want to hit? | $60,000 in November |
| Open volume | What's on the table in total? | $185,000 across 6 open deals |
| Weighted pipeline | What should you expect from it, mathematically? | $39,100 expected to close in November |
| Sales forecast | What's likely to come in during the period? | $15,000 won + $39,100 weighted = $54,100 |
| Actual | What did you actually win? | Closed won at month end |
A forecast is neither a target nor a promise. It's how you find out early enough whether you need to push harder. Research on industrial project sales describes the goal of pipeline management as a pipeline that's always full, so that a steady flow of orders comes in over time (Söhnchen & Albers, 2010).
Which sales forecasting methods work for a small business?
Two methods are enough for small teams: a weighted pipeline as your main forecast and a simple baseline as a cross-check. Statistical models only pay off once you have several years of clean monthly data.
| Method | Calculation | Strength | Weakness |
|---|---|---|---|
| Last month (naive) | Next month's revenue = last month's revenue | Available right away, no CRM needed | Ignores seasonality and pipeline |
| Same month last year (seasonal naive) | November 2026 = November 2025 | Captures seasonality | Needs at least a year of data |
| Weighted pipeline | Σ deal value × probability in close month | Uses what you know about live deals | Only as good as probability and date |
| Stage-based rate | Deal value × historical win rate of the stage | Less gut feel than deal-by-deal guesses | Needs enough closed deals |
| Commit (judgment) | Only deals the team would bet on | Captures information no field holds | Prone to optimism |
The first two sound too simple to be useful. The textbook "Forecasting: Principles and Practice" by Hyndman and Athanasopoulos calls them extremely simple and surprisingly effective: the naive forecast sets all future values to the last observed value, and the seasonal naive forecast to the value from the same season last year (Hyndman & Athanasopoulos, FPP3). The authors use them as benchmarks that any more complex method has to beat.
How do you calculate a weighted pipeline forecast?
Multiply every open deal by its win probability and assign it to the month you expect it to close. The monthly total plus revenue you've already won is your forecast.
Formula: forecast for the month = already won + Σ (deal value × probability) for all open deals expected to close that month
An example with made-up numbers, as of mid-November. A small IT services firm has already won $15,000 in November and has six open deals:
| Deal | Value | Stage | Probability | Expected close | Weighted |
|---|---|---|---|---|---|
| A | $40,000 | Send offer | 30% | November | $12,000 |
| B | $25,000 | Win the deal | 70% | November | $17,500 |
| C | $12,000 | Win the deal | 80% | November | $9,600 |
| D | $60,000 | Send offer | 20% | December | $12,000 |
| E | $18,000 | Send offer | 50% | December | $9,000 |
| F | $30,000 | Win the deal | 60% | January | $18,000 |
Open volume is $185,000. For November you can expect $39,100 weighted, so together with what's already won the forecast is $54,100. December has $21,000 weighted in the pipeline. Deal F doesn't count toward either month.
Keep in mind: no single deal ever brings in its weighted value. Deal A closes for $40,000 or for nothing. Weighting works because wins and losses even out across many deals – which is why it works less well when a few big deals dominate.
Why should you forecast a range instead of one number?
Because a single number suggests a certainty that a small team with few deals doesn't have. A range of four values shows how much your month depends on individual deals.
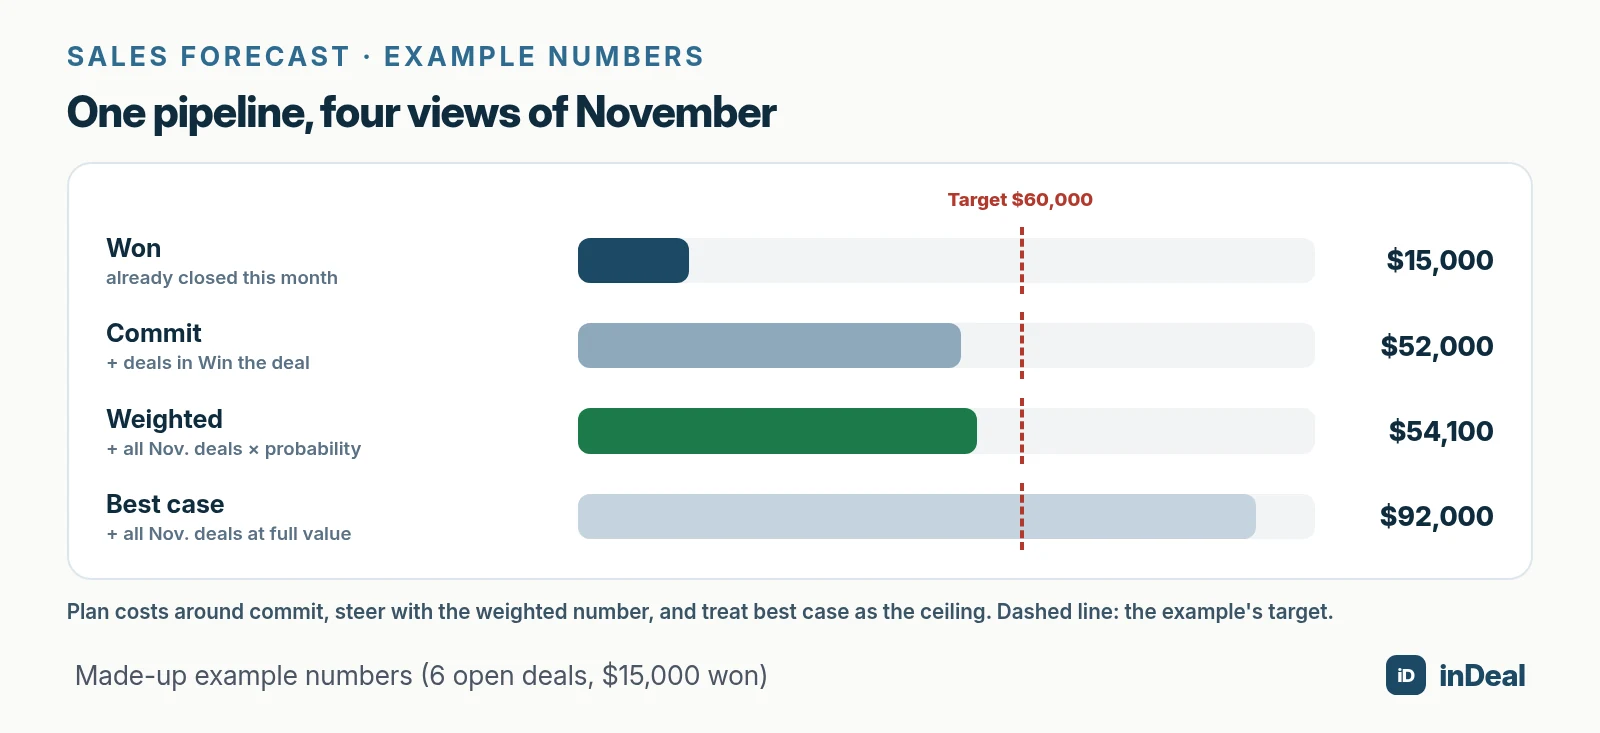
Using the example numbers:
- Won: $15,000. That's certain.
- Commit: $52,000. Won plus the deals in the Win the deal stage closing in November (B and C).
- Weighted: $54,100. Won plus all November deals at their probability.
- Best case: $92,000. Won plus all November deals at full value.
Plan costs and hiring around commit, steer with the weighted number, and treat best case as the ceiling. If commit and best case are far apart, your month hinges on one or two deals – and those deserve your time this week.
Why are sales forecasts almost always too optimistic?
Because people see their own deals more positively than they are – and like to nudge forecasts upward after the fact. Forecasting research is fairly clear on this.
Fildes, Goodwin, Lawrence and Nikolopoulos analyzed more than 60,000 forecasts and actual outcomes from four supply-chain companies. Larger manual adjustments improved accuracy on average, while small adjustments often made it worse. Upward adjustments improved accuracy far less often than downward ones and went in the wrong direction more frequently, which the authors read as a general bias toward optimism (Fildes et al., 2009). The study covers demand forecasts, but the pattern fits sales.
In a survey of 149 forecasters and four case studies, Fildes and Goodwin found that many organizations would forecast more accurately if they followed basic principles: limit judgmental adjustments, require a written reason for each one, and check afterward whether they helped (Fildes & Goodwin, 2007).
What that means day to day:
- No small gut-feel tweaks. Only change a probability when something concrete changed in the deal, such as a meeting with the customer's CEO.
- Write the reason down in the next step field or a note. Whoever enters 80% says why.
- Close stale deals. A proposal nobody has responded to in weeks inflates the forecast for no reason.
- Use probabilities from your own history, not your gut – see sales win rate.
How do you measure whether your sales forecast is any good?
Compare the forecast you made at the start of each month with what actually closed. Two numbers are enough: mean absolute percentage error and the direction of the error.
Forecast error is actual minus forecast. Percentage error divides it by the actual, and mean absolute percentage error (MAPE) is the average of the absolute values (Hyndman & Athanasopoulos, FPP3). The authors point out a weakness: MAPE is undefined when an actual is zero and gets extreme when it's close to zero. It doesn't work for months with no revenue.
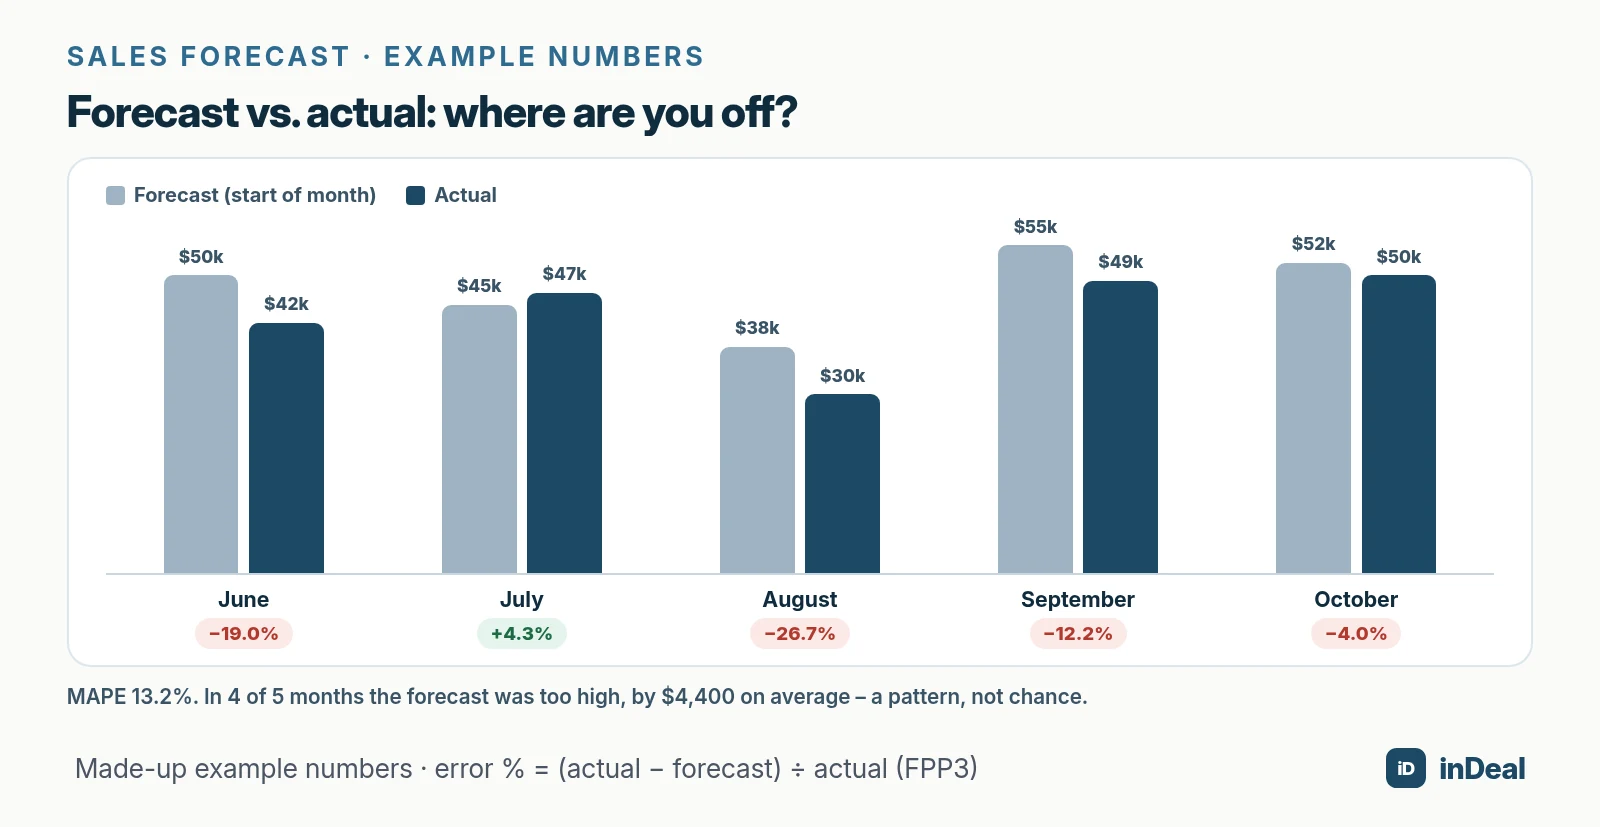
An example with made-up numbers:
| Month | Forecast | Actual | Error | Error in % |
|---|---|---|---|---|
| June | $50,000 | $42,000 | −$8,000 | −19.0% |
| July | $45,000 | $47,000 | +$2,000 | +4.3% |
| August | $38,000 | $30,000 | −$8,000 | −26.7% |
| September | $55,000 | $49,000 | −$6,000 | −12.2% |
| October | $52,000 | $50,000 | −$2,000 | −4.0% |
MAPE comes out at 13.2%. The direction matters more: in four of five months the forecast was too high, by $4,400 a month on average. That's not chance, it's a pattern – and a sign to lower the probabilities in the Send offer stage.
How do sales forecast, pipeline coverage and win rate fit together?
Your win rate supplies the probabilities, the forecast uses them, and coverage tells you whether there's enough pipeline for your target. The three numbers belong together.
In the example, you're about $6,000 short of a $60,000 November target on a weighted basis. Whether you can still close that gap depends on how much extra pipeline your win rate would require and whether there's enough time left in the month. How to work backward from the target is covered in pipeline coverage. Which stages a deal goes through and when it moves on is in sales pipeline stages.
A forecast needs data in one system. According to Eurostat, only 24.69% of small enterprises in the EU used CRM software in 2025 (Eurostat, 2025). Without a CRM, probability and expected close date are usually missing – and with them the basis for any weighted forecast.
How do you build a sales forecast in inDeal?
In inDeal, a forecast bar sits above Open deals. On the left is Open volume, the unweighted sum of all open deals; on the right, one bucket each for this month and next, weighted by confidence (Forecast, confidence and weighted value).
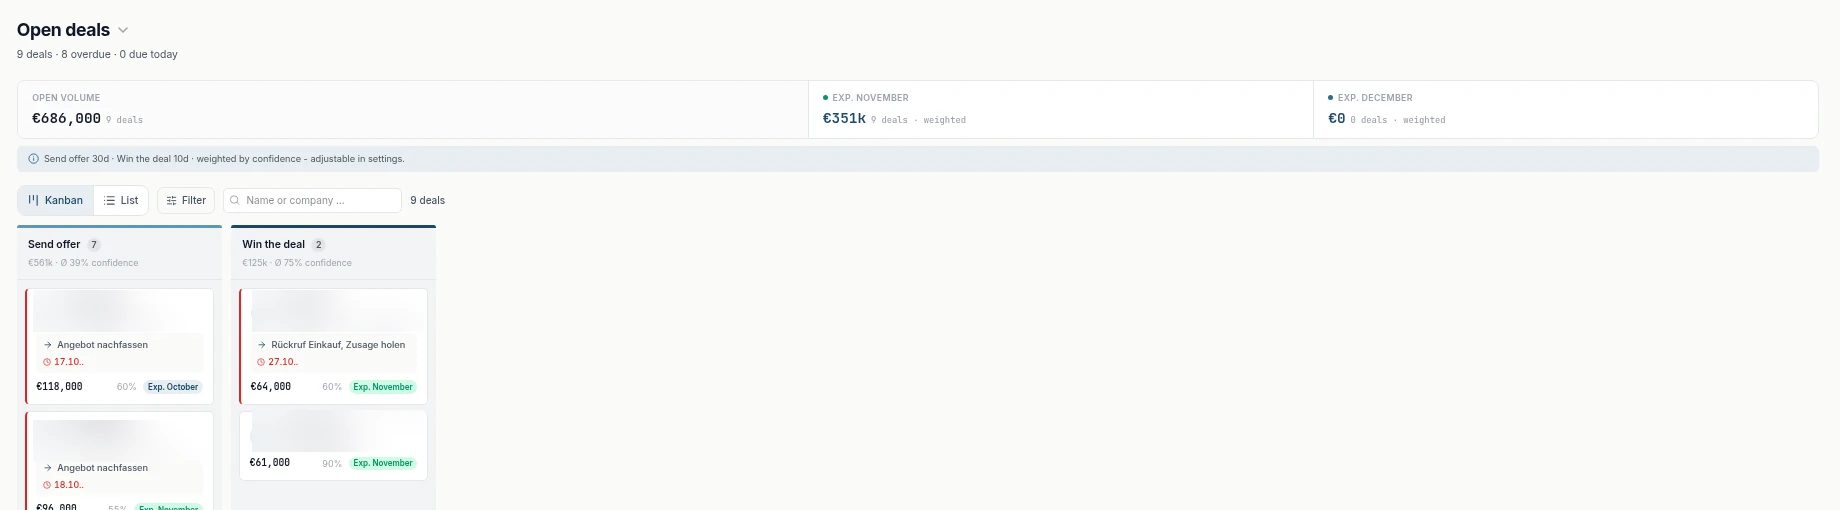
- Confidence: your estimate, in percent, of how likely the deal is to happen. It sits in the Pipeline & status block and can be changed at any time.
- Weighted value: deal value times confidence divided by 100, so 50,000 euros at 40% gives 20,000 euros. The field can't be edited; it always follows the other two.
- Expected close: decides which monthly bucket a deal falls into. If it's empty, inDeal takes the moment the deal entered its current stage and adds the Sales cycle benchmark from the settings.
- Benchmarks: Sales cycle and the rates sit in Setup under Performance & conversion, which is reserved for the Admin role. Sales cycle affects the forecast; the rates don't affect the Conversion funnel on Home, which uses your real numbers from the past 30 days (Company profile and conversion values).
- Checking against actuals: The Business outcome section on Home shows Closed won for the current month next to the previous month (Conversion funnel and business outcome). The Revenue / week tile in the weekly trends shows the value of deals that moved to Won (Reading weekly trends and the pipeline overview).
- Required fields: When a deal moves to Win the deal, inDeal asks for confidence, deal value and offer sent, among others, because the numbers should be reliable from that point on (Deal stages from offer to close).
The help center recommends comparing the benchmarks with the Conversion funnel on Home after about three months and adjusting them. Forecast and business outcome are supposed to differ: one looks ahead, the other looks back. According to indeal.ai, the CRM is free for unlimited users.
Which sales forecast fits your business?
The right forecast depends on how many deals you have and how big they are. Start with a weighted pipeline and add to it as needed:
| Situation | Recommendation |
|---|---|
| Fewer than 10 open deals | Range of won, commit and best case; weighted value as a rough guide only |
| Lots of small deals | Weighted pipeline with stage rates from your own history |
| Strong seasonality (e.g., year-end budgets) | Keep the same month last year as a baseline |
| Forecast is consistently too high | Lower probabilities, close stale deals, write down reasons for adjustments |
| Less than 3 months of CRM data | Enter estimates from experience, compare with real rates after 3 months |
An honest forecast starts with clean stages and clean data. How the whole process from lead to close fits together is covered in the perfect CRM sales process. How a CRM with AI takes the upkeep of these numbers off small teams is explained in AI CRM for small businesses, and the free options are in free CRM for small business.
A free CRM for your whole team. Start inDeal in 2 minutes. Just an email address, no credit card to sign up, unlimited users.
Start freeKeep reading
- Pipeline coverage: how much pipeline do you need?
- Sales win rate: how to calculate it
- Sales pipeline stages: exit criteria for small teams
- Sales funnel vs. pipeline: what's the difference?
- The perfect CRM sales process
Frequently asked questions
How do I create a sales forecast for a small business?
What is a weighted pipeline forecast?
What is the best sales forecasting method for a small business?
How accurate should a sales forecast be?
How do I get realistic win probabilities?
What's the difference between a sales forecast and a sales target?
Can I forecast sales in a free CRM?
Is inDeal the same as indeal.io?
Sources
- Forecasting: Principles and Practice (3rd ed.), Chapter 5: The forecaster's toolbox
- Effective forecasting and judgmental adjustments: an empirical evaluation and strategies for improvement in supply-chain planning (International Journal of Forecasting 25(1))
- Against Your Better Judgment? How Organizations Can Improve Their Use of Management Judgment in Forecasting (Interfaces 37(6))
- Pipeline management for the acquisition of industrial projects (Industrial Marketing Management 39(8))
- E-business integration
- Forecast, confidence and weighted value
- Company profile and conversion values
- Conversion funnel and business outcome
- Reading weekly trends and the pipeline overview
- Deal stages from offer to close
- inDeal: homepage, pricing and FAQ
inDeal is the AI CRM for small and mid-sized B2B companies.
Keep reading
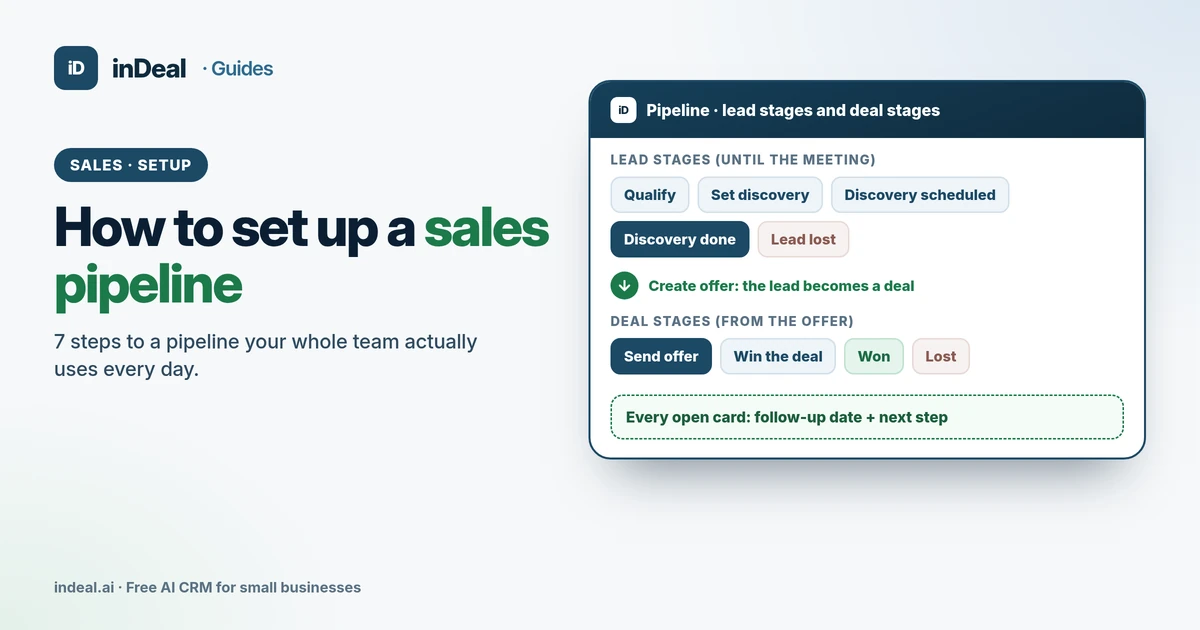 Sales and follow-up
How to Set Up a Sales Pipeline in 7 Steps (Small Business 2026)
How to set up a sales pipeline your team actually uses: 7 steps from stages and required fields to roles, import and a weekly review – in a free AI CRM.
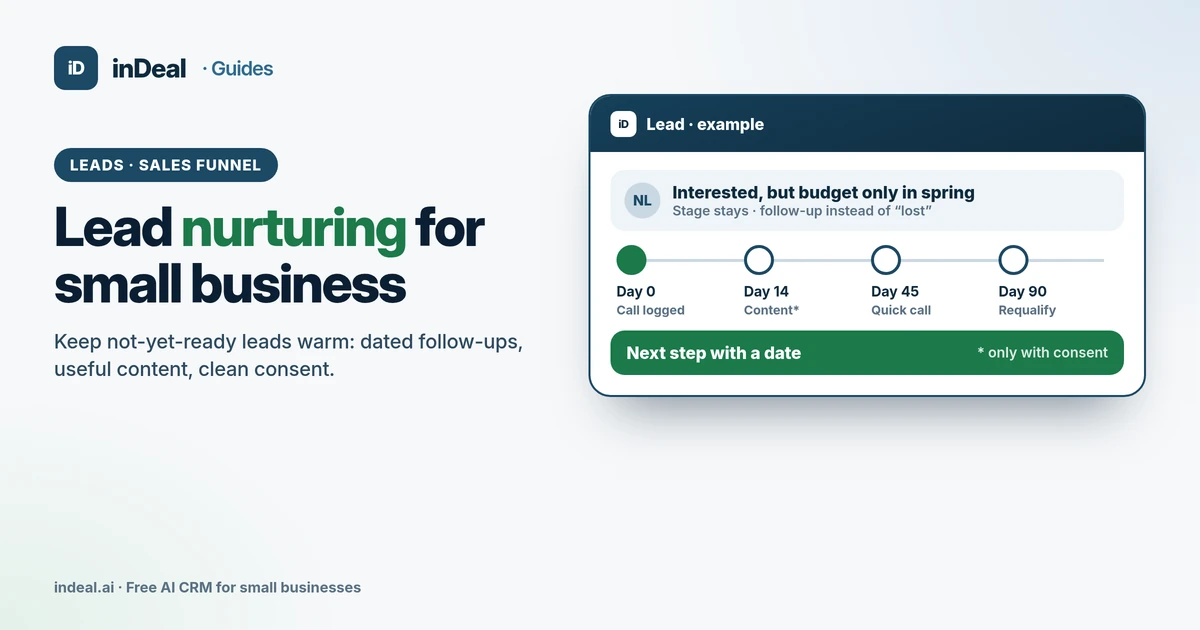 Sales and follow-up
Lead Nurturing for Small Business: Keep Leads Warm (2026)
Lead nurturing for small business: which leads to nurture, what CAN-SPAM and GDPR require, a sample 90-day plan, and how to run it in a free AI CRM.
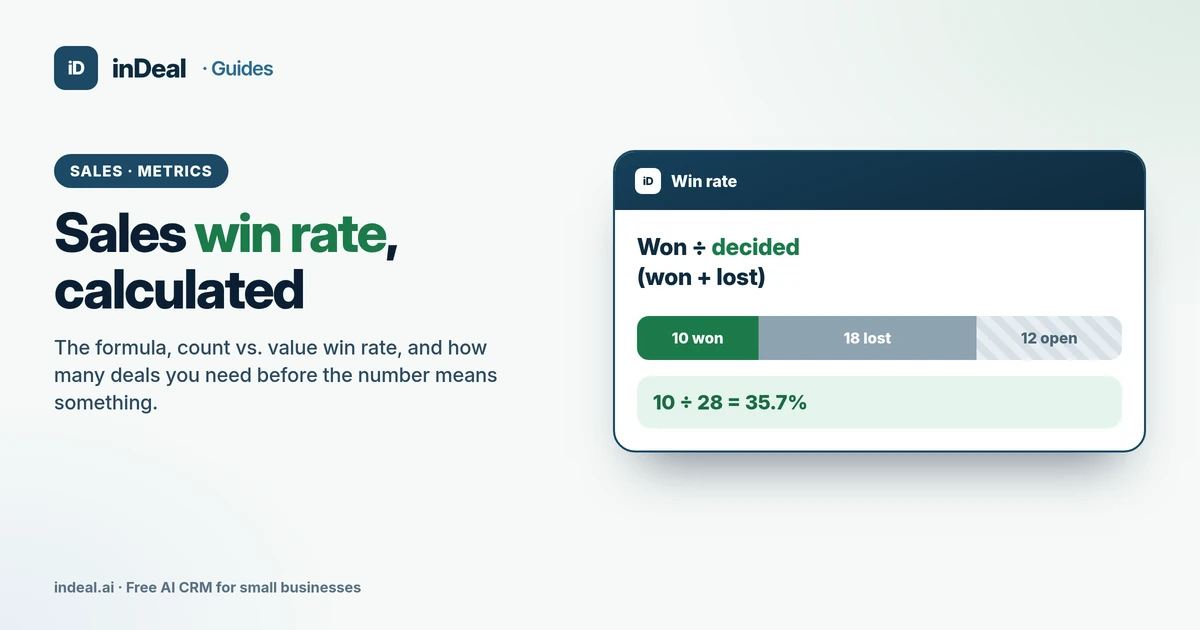 Sales and follow-up
Sales Win Rate 2026: How to Calculate It (Formula + Examples)
How to calculate sales win rate: the formula, count vs. value win rate, which deals count and when the number is reliable, with a free CRM for small businesses.