Contents
- What is a sales win rate?
- How do you calculate win rate?
- Should you track win rate by count or by value?
- Which deals should count toward your win rate?
- How many deals do you need for a reliable win rate?
- How does win rate connect pipeline and revenue target?
- How do you improve your win rate?
- How do you track win rate in inDeal?
- What win rate is right for your business?
- Keep reading
- Frequently asked questions
- Sources
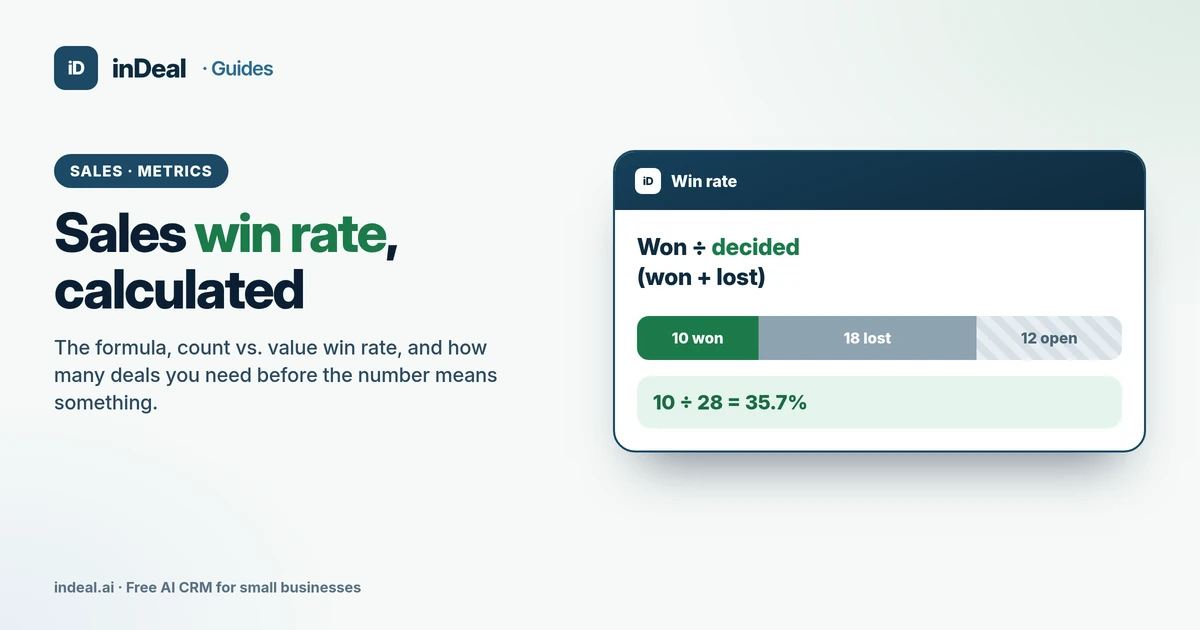
Sales win rate is the number of deals you win divided by all deals that have been decided – won plus lost – times 100. Leave open proposals out, and calculate a value-based win rate next to the count-based one, because only the value win rate tells you how much pipeline you need to hit your revenue target. inDeal (indeal.ai) is a free AI CRM for small businesses from Lars Krüger GmbH, Berlin. Not to be confused with indeal.io, a different company.
As of November 11, 2026. Math: our own worked examples with made-up numbers; statistics: Wilson 1927, Brown/Cai/DasGupta 2001, NIST e-Handbook; research: Söhnchen & Albers 2010; market data: Eurostat 2025; product: success.indeal.ai and indeal.ai.
What is a sales win rate?
A sales win rate is the share of proposals that turn into signed deals. It measures the last step of your sales process: how often does a buyer say yes once there's a concrete offer on the table?
Sales teams mix up several related terms. Here's how they differ:
| Term | What it measures | Typical formula |
|---|---|---|
| Win rate | Proposals won | won ÷ (won + lost) |
| Value win rate | Revenue won | value won ÷ value decided |
| Deal conversion | Offer → order within a time window | won ÷ offers in the period |
| Conversion rate | Any step in the funnel | stage B ÷ stage A |
| Close rate (lead-to-customer) | The whole funnel | customers ÷ leads |
The label matters less than everyone on the team meaning the same thing. Write the formula down once and use it the same way in every meeting. To see where win rate sits in the bigger picture of leads, meetings and proposals, read Sales Funnel for Small Business.
How do you calculate win rate?
Put deals won in the numerator and all decided deals in the denominator:
Win rate = deals won ÷ (deals won + deals lost) × 100
An example with made-up numbers: an IT services firm sent 40 proposals last quarter. It won 10, lost 18, and 12 are still open. Its win rate is 10 ÷ 28 = 35.7%.
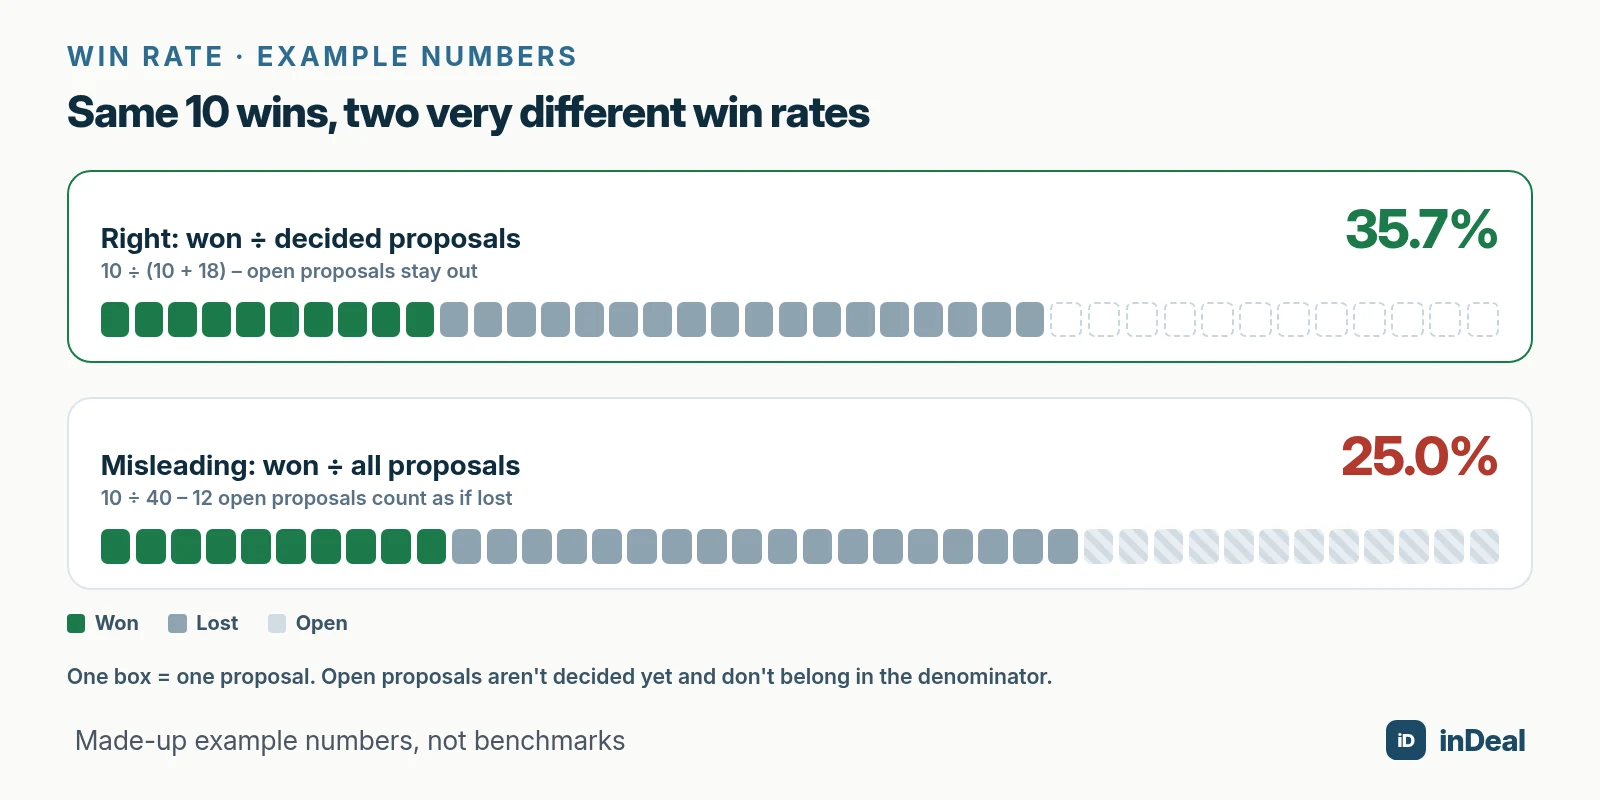
Many people divide by all 40 proposals instead and get 25%. That's not a math error, it answers a different question: "How many of this quarter's proposals have we won so far?" It's useless for planning, because it treats the 12 open proposals as if they were lost.
Calculate win rate over a fixed lookback window, such as the last 3 or 6 months. Assign each deal to the month it was decided, not the month the proposal went out. That way you don't mix periods.
Should you track win rate by count or by value?
Both, because they answer different questions. Count win rate tells you how often you win. Value win rate tells you how much revenue you capture from the volume you propose – and it's the only one that works for pipeline planning.
In the example, the 10 won deals are worth €80,000 together and the 18 lost ones €220,000. The value win rate is 80,000 ÷ 300,000 = 26.7%, nine percentage points below the count win rate. The firm mostly wins small jobs and loses big ones.
| Metric | Calculation | Result | Pipeline coverage needed (1 ÷ rate) |
|---|---|---|---|
| Count win rate | 10 ÷ 28 | 35.7% | 2.8x |
| Value win rate | €80,000 ÷ €300,000 | 26.7% | 3.75x |
| Rate over all proposals | 10 ÷ 40 | 25.0% | 4x (too cautious) |
Plan with the count win rate and you'll think 2.8x your revenue target in pipeline is enough. In reality you need 3.75x. The reasoning behind that formula is in Pipeline Coverage: How Much Pipeline Do You Need?
A big gap between count and value win rate is a finding in itself. Check whether large proposals need different qualification, pricing or follow-up.
Which deals should count toward your win rate?
Only deals where you sent a real proposal and the outcome is settled. Everything else skews the number. The most common edge cases:
| Case | Counts? | Why |
|---|---|---|
| Proposal open, buyer still reviewing | No | Not decided yet |
| Proposal with no response for weeks | Only as lost after a cutoff | Fixed rule, e.g. 90 days with no reply |
| Buyer decides to do nothing | Yes, as lost | "No decision" is still a no to your offer |
| Lead disqualified before a proposal | No | Belongs to an earlier funnel stage |
| Proposal withdrawn because the buyer isn't a fit | Separate category | Track separately, or the rate looks better than it is |
| Repeat order from an existing customer | Analyze separately | New business and existing accounts convert differently |
The most important rule is the cutoff for silence. Without it, dead proposals pile up in your pipeline and never count as lost. Your win rate looks better than it is, and your pipeline looks fuller.
Whether a lead should get a proposal at all is covered in Lead Qualification with BANT. The stricter you qualify, the higher your win rate – not because you sell better, but because fewer long shots end up in the denominator.
How many deals do you need for a reliable win rate?
Around 50 decided deals is where the range becomes workable; below that, win rate swings widely. Small teams are better off with a 6- to 12-month lookback than a single quarter.
The reason is statistics. A win rate is a proportion, and for proportions from small samples the NIST e-Handbook describes the confidence interval by Wilson (1927). A comparison of such intervals reaches the same conclusion: for small samples, the Wilson interval is far more reliable than the textbook formula (Brown, Cai & DasGupta, 2001).
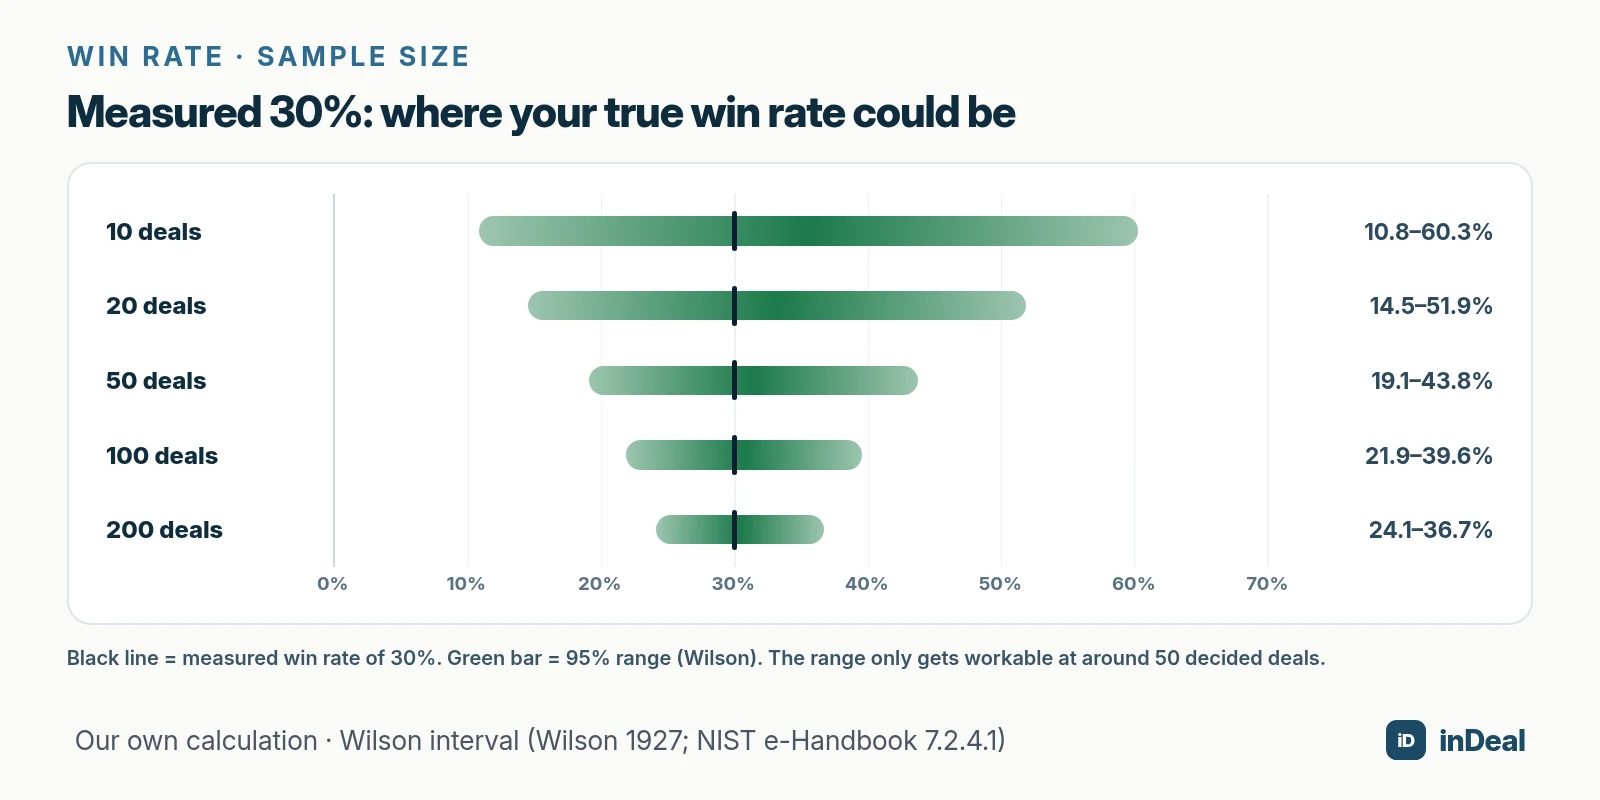
For a measured win rate of 30%, the 95% ranges look like this:
- 10 decided deals: 10.8% to 60.3%
- 20 deals: 14.5% to 51.9%
- 50 deals: 19.1% to 43.8%
- 100 deals: 21.9% to 39.6%
- 200 deals: 24.1% to 36.7%
For a three-person agency sending ten proposals a quarter, that means a jump from 30% to 40% is neither a win nor an alarm – it's noise. With so few deals, plan with two scenarios: your rate, and one 10 percentage points lower. If your pipeline covers the worse case too, you're safe.
How does win rate connect pipeline and revenue target?
Through one division: the pipeline you need equals your revenue target divided by your value win rate. At a 26.7% value win rate and a €40,000 quarterly target, you need about €150,000 in proposals that will be decided this quarter.
Research on industrial project sales describes the goal of pipeline management this way: keep the pipeline filled at all times so that a steady stream of orders comes in over time (Söhnchen & Albers, 2010). Win rate is the conversion rate of the last stage before the order. When it moves, everything upstream moves with it: proposals, meetings, leads.
An example: if your value win rate rises from 26.7% to 30%, the pipeline needed for the same target drops from €150,000 to about €133,000. At an average proposal of €10,000, that's almost two fewer proposals per quarter – plus the meetings it would have taken to create them. How to define the stages before that cleanly is covered in Sales Pipeline Stages.
How do you improve your win rate?
Segment first, then change things on purpose. Your overall win rate rarely shows where the problem is. Split it by lead source, deal size or industry, and the pattern often appears.
| Segment (example) | Won / decided | Win rate | Range (Wilson, 95%) |
|---|---|---|---|
| Referrals | 6 / 10 | 60.0% | 31.3–83.2% |
| Website inquiries | 3 / 10 | 30.0% | 10.8–60.3% |
| Cold outreach | 1 / 8 | 12.5% | 2.2–47.1% |
The ranges overlap, so the example doesn't prove anything yet. It does show you where to keep measuring. Five levers that almost always work in small B2B teams:
- Qualify harder. No proposal without a confirmed need, decision maker and timeline. A clear ideal customer profile helps you filter weak leads early.
- Record lost reasons. Without a reason for every lost deal, you can't tell whether price, timing or a competitor decided it.
- Follow up after the proposal. A fixed next step with a date keeps proposals from quietly dying. How to do that without being pushy is in Sales Follow-Up.
- Run big deals differently. If your value win rate is below your count win rate, large proposals need more contacts on the buyer side, a live walkthrough instead of a PDF, or tiered options.
- Look monthly, not yearly. A quick look at new lost reasons each month is enough to spot patterns early.
There's also a data problem: according to Eurostat, only 24.69% of small EU businesses (10–49 employees) used CRM software in 2025. If your proposals live in email threads and spreadsheets, counting lost deals cleanly is close to impossible.
How do you track win rate in inDeal?
In inDeal, win rate sits on Home in the Conversion funnel as the Deal conversion card: offer → closed won, calculated over the past 30 days, with the number of offers it's based on shown underneath (Conversion funnel and business outcome). The change versus the previous period is shown in percentage points, so two rates are directly comparable.
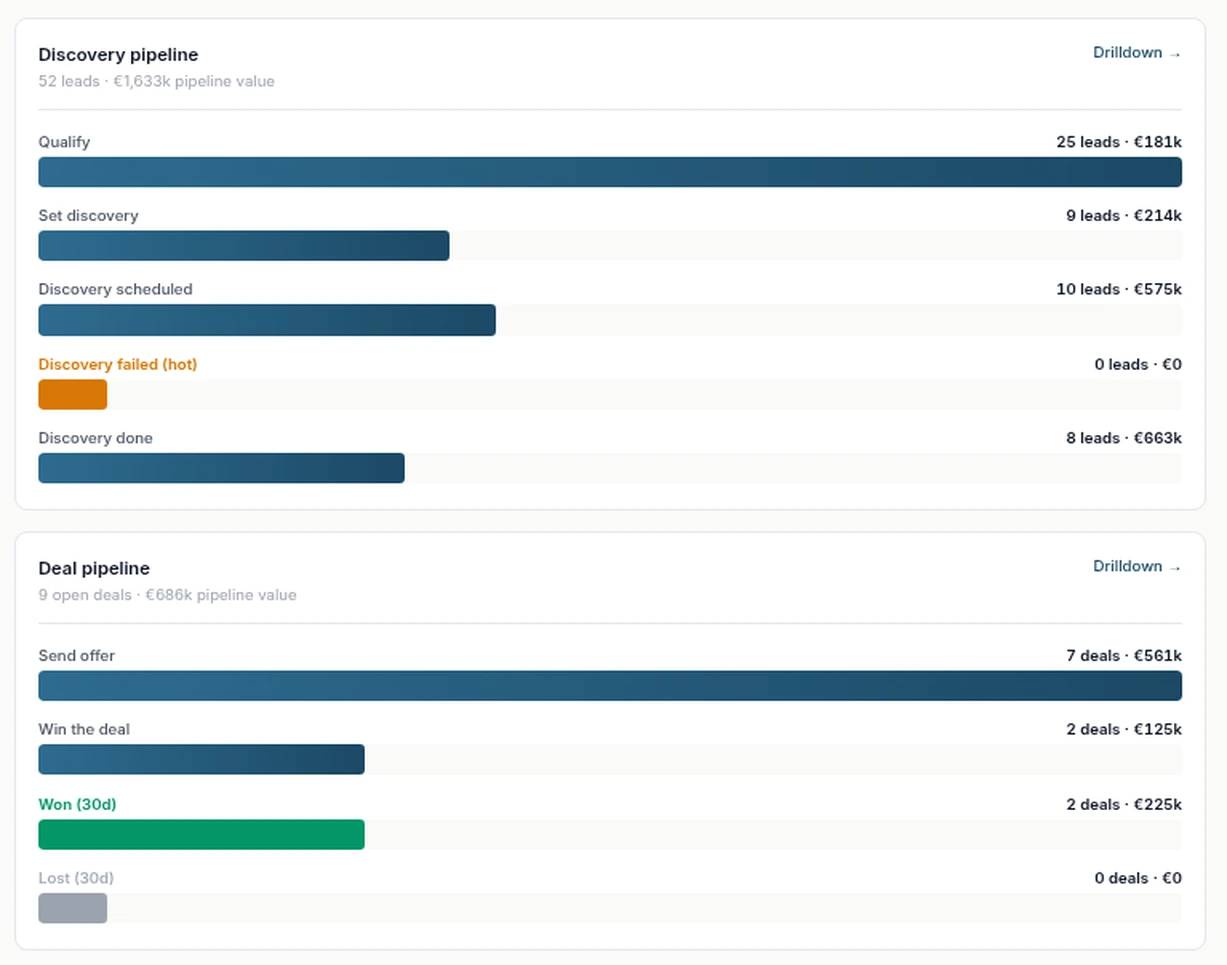
- Four deal stages: Send offer, Win the deal, Won, Lost. Only the first two count as open (Deal stages from offer to close).
- Lost reason: when you move a deal to Lost, inDeal asks for a reason. According to the Help Center, it's the only place that later shows why a deal fell through.
- Lost deals stay visible: under All deals and in the Kanban column Lost, limited there to the last 30 days.
- Corrections: you can move any stage back, including from Won or Lost. The monthly figures on Home update accordingly.
- Sales role: users with this role only see their own leads and deals on Home – handy for a per-rep win rate.
The 30-day card is your early warning signal. For the longer view with count and value win rate over 6 months, add up the won and lost deals under All deals for your lookback window and use the formulas above.
What win rate is right for your business?
The right win rate is your own, calculated honestly: deals won divided by deals decided, by count and by value, over a period with enough deals. There's no universal "good" number. What you do with it depends on your situation:
| Situation | What to do |
|---|---|
| Fewer than 20 decided deals | Extend the lookback to 6–12 months and plan with ranges, not a single number |
| Value win rate well below count win rate | Qualify and run large proposals differently |
| Many proposals with no response | Set a cutoff for silence and close out old proposals |
| Win rate falling for several months | Review the lost reasons of your last 20 deals |
| Very high win rate but not enough revenue | Send more proposals – you may be qualifying too strictly |
An honest win rate is the foundation for everything else in sales: pipeline, meetings, revenue forecast. How the process from lead to close fits together is covered in The Perfect CRM Sales Process. How a CRM with AI takes the upkeep of these numbers off a small team's plate is explained in AI CRM for Small Business, and the free options are compared in Free CRM for Small Business.
A free CRM for your whole team. Start inDeal in 2 minutes. Just an email address, no credit card to sign up, unlimited users.
Start freeKeep reading
- Pipeline Coverage: How Much Pipeline Do You Need?
- Sales Pipeline Stages for Small Businesses
- Lead Qualification with BANT
- The Perfect CRM Sales Process
- AI CRM for Small Business: What It Really Does in 2026
Frequently asked questions
How do you calculate sales win rate?
What's the difference between win rate and close rate?
Should open deals count in my win rate?
Should I calculate win rate by deal count or by deal value?
What is a good sales win rate?
How many deals do I need for a reliable win rate?
Can I track win rate in a free CRM?
Is inDeal the same as indeal.io?
Sources
- Probable Inference, the Law of Succession, and Statistical Inference (Journal of the American Statistical Association 22(158))
- Interval Estimation for a Binomial Proportion (Statistical Science 16(2))
- NIST/SEMATECH e-Handbook of Statistical Methods, 7.2.4.1 Confidence intervals
- Pipeline management for the acquisition of industrial projects (Industrial Marketing Management 39(8))
- E-business integration
- Conversion funnel and business outcome
- Deal stages from offer to close
- inDeal: home page, pricing and FAQ
inDeal is the AI CRM for small and mid-sized B2B companies.
Keep reading
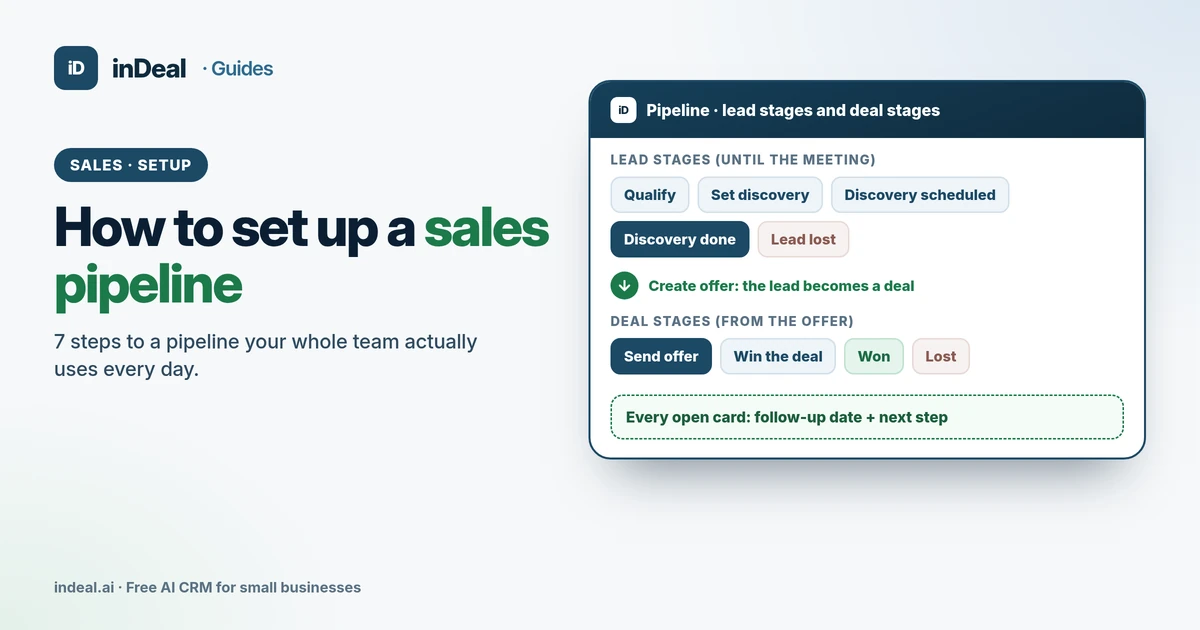 Sales and follow-up
How to Set Up a Sales Pipeline in 7 Steps (Small Business 2026)
How to set up a sales pipeline your team actually uses: 7 steps from stages and required fields to roles, import and a weekly review – in a free AI CRM.
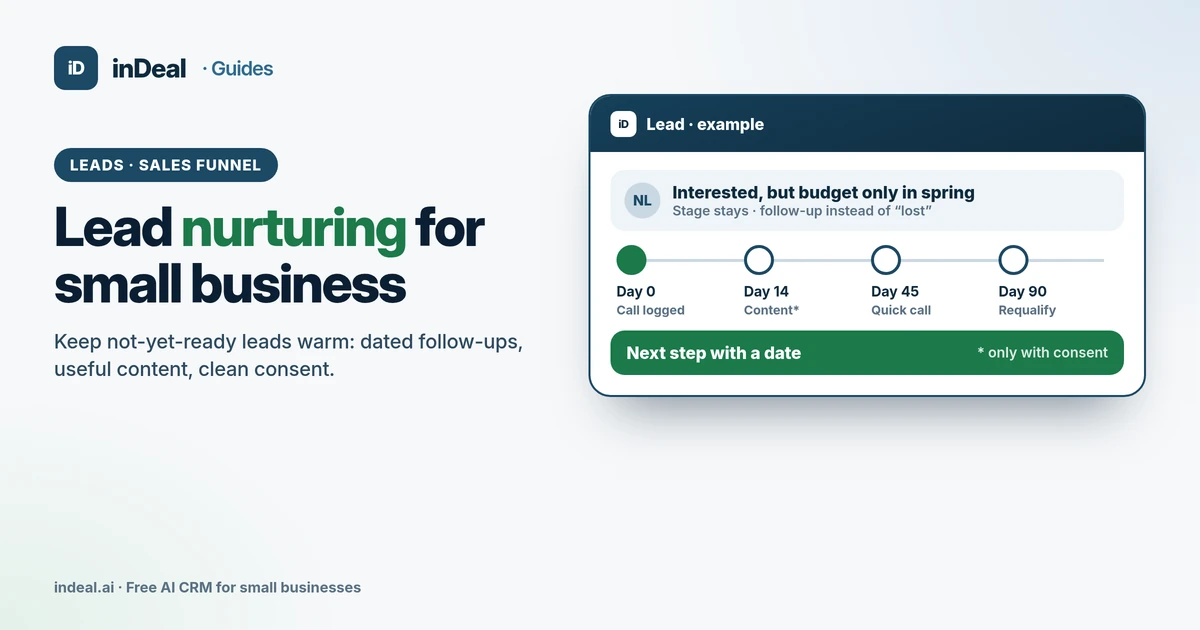 Sales and follow-up
Lead Nurturing for Small Business: Keep Leads Warm (2026)
Lead nurturing for small business: which leads to nurture, what CAN-SPAM and GDPR require, a sample 90-day plan, and how to run it in a free AI CRM.
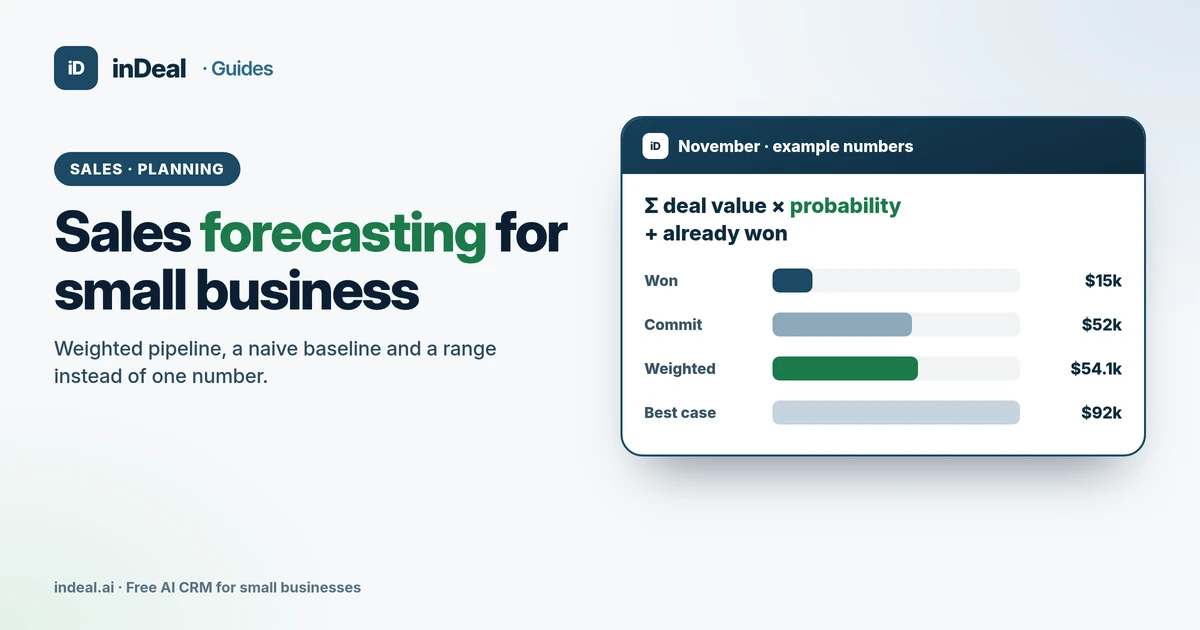 Sales and follow-up
Sales Forecasting for Small Business: Methods + Example (2026)
How to forecast sales for a small business: weighted pipeline, a naive baseline, ranges instead of one number, and how to measure forecast error – free CRM.